Software has replaced pen and pencil that was used for drawing by hand. Digital designs have become the staple choice in graphic design. With more and more things coming within the ambit of the digital world, it is therefore no surprise that graphic design in now entirely software driven.
Software has made graphic design much more versatile. It is now possible to create designs that are unique and high impacting by using technology to your advantage.
There are several free tools available online and 10 of these have been discussed in this post.
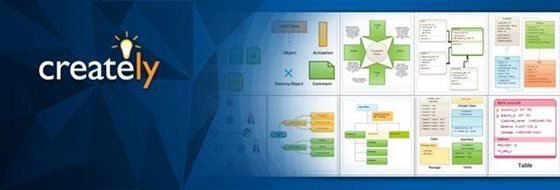
Creately is a visual collaboration platform which is used by project teams to communicate more effectively.
It's easy to use interface and shared projects, development and business teams can collaborate on software designs, business & strategy diagrams easily.
You had never found it so easy to create flow charts and draw diagrams as you would find with Creately, the tool that has been developed to aid infographic designs.
Select from the available diagrams that match closest with your requirements and tweak it the way you want.
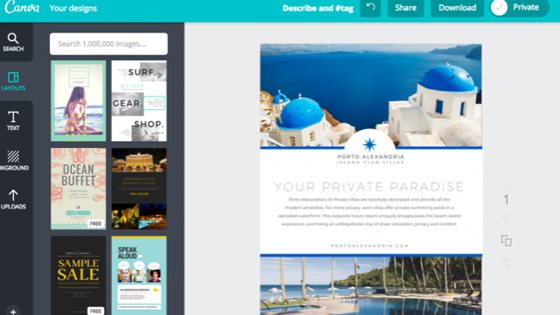
Canva has a wide range of infographics templates to use and edit as needed. You can start by browsing through the different layouts and choose the best fit for your needs.
This tool houses a library of images, fonts and features as well as icons that can be used as you wish to create the most attractive design. This easy to use tool is ideal for designing anything from presentations to brochures and much more.
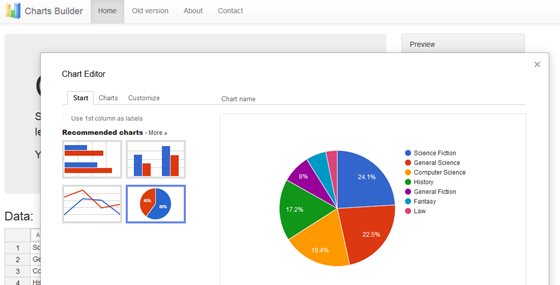
Hohli's chart builder is best fit for those looking for graphs without the bells and whistles. Constructing a new graph is a simple and linear process.
There is also ability to customize your orientation and chart size, so if you need a horizontal graph instead of a vertical, you're in luck.
A variety of readymade charts are available with this tool that is specifically developed for making charts. Simply pick one that meets your requirement, add data, change the colors and size and there your chart is ready for presentation.
Easel.ly is a website that features many of free infographics templates and design objects which users can customize to create and share their visual ideas. At least a dozen free templates are available with this web based tool.
The templates can be customized to your needs and is supported by the choice of colors, text, styles, fonts as well as arrows, lines and shapes of different sizes.
Combining elements of data analysis, good design, and more into an effective visual representation of a data takes a lot of time, tools, and experience to do it right. However, Many Eyes project may change all of this.
This tool allows you to use your own data or make use of the data that is provided with it. The visualizations have a professional look in its presentation and are well designed. It is a great way to use your data to show it online.
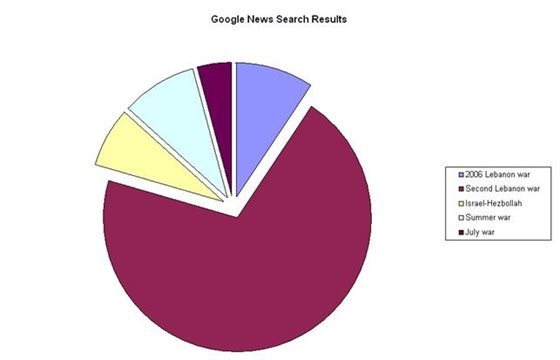
The Google Chart is a tool that lets people to easily create a chart from some data and embed it in web page. Many types of charts are supported, and by making the request into an image tag, people can simply include the chart in a web page.
The chart making tool is easy to use and you are able to configure various options that you have in mind to match with the requirements of your website. You can get the right feel and looks for your website without any stress.
Inkscape is a open-source and free vector graphics editor; it can be used to create or edit vector graphics such as diagrams, illustrations, charts and logos.
This vector graphic software is compatible with many platforms. It is an intuitive and simple tool that can be used to meet all your requirements for infographic designing.
Wordle is a toy of generating 'word clouds' from text that you provide. The clouds give greater prominence to words which appear more frequently in the source text.
You can tweak your clouds with different layouts, fonts and color schemes. The images you create with Wordle are yours to use however you like. You can print them out, or save them to your own desktop to use.
Text visualizations are easy to do with this tool. Enter a text and see how the tool interprets and visualizes it. There are numerous designs to be chosen from and you can even enter a complete book to give it a different look.

Data about major issues happening worldwide is stored in this tool that can be used to create visualizations. The visuals are very impressive and the data is updated yearly.

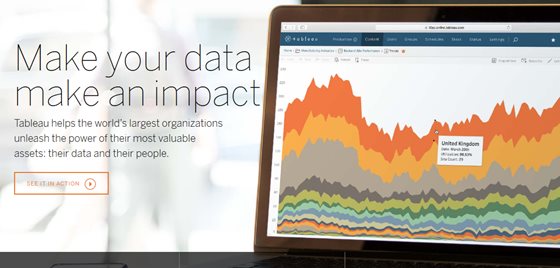
Tableau allows instantaneous insight by transforming data into visually appealing, interactive visualisations called dashboards. This process takes only minutes rather than months or years, and is achieved through the use of an easy to use drag and drop interface.
Graphs can be made very colorful and creative with this tool. With a range of visualization options, you can create off beat graphs that are highly attractive.